Reading reports
Start with the portfolio, locate the symbols driving the result, and verify the conclusion at trade level.
Portfolio overview
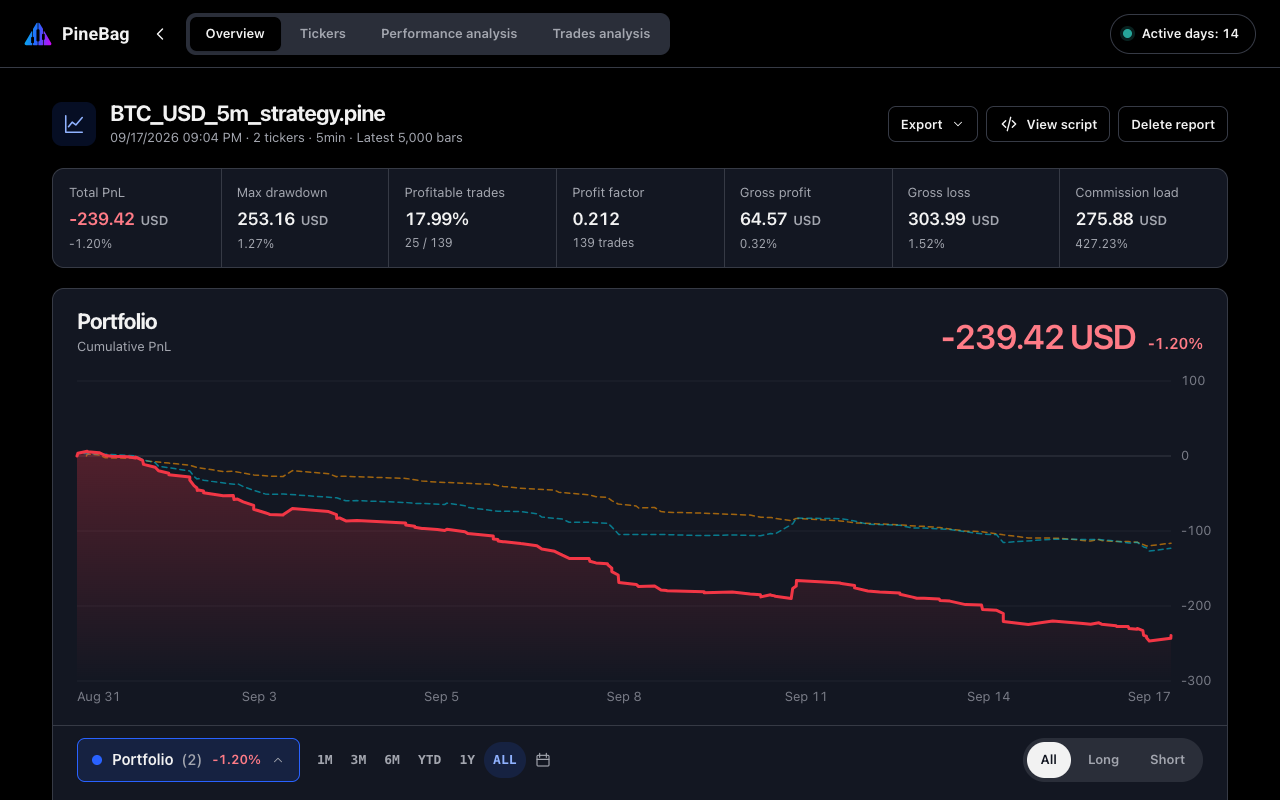
Use net profit, maximum drawdown, profit factor, win rate and the equity curve together. A strong headline return with a concentrated contribution or a deep drawdown deserves more investigation.
Tickers and periods
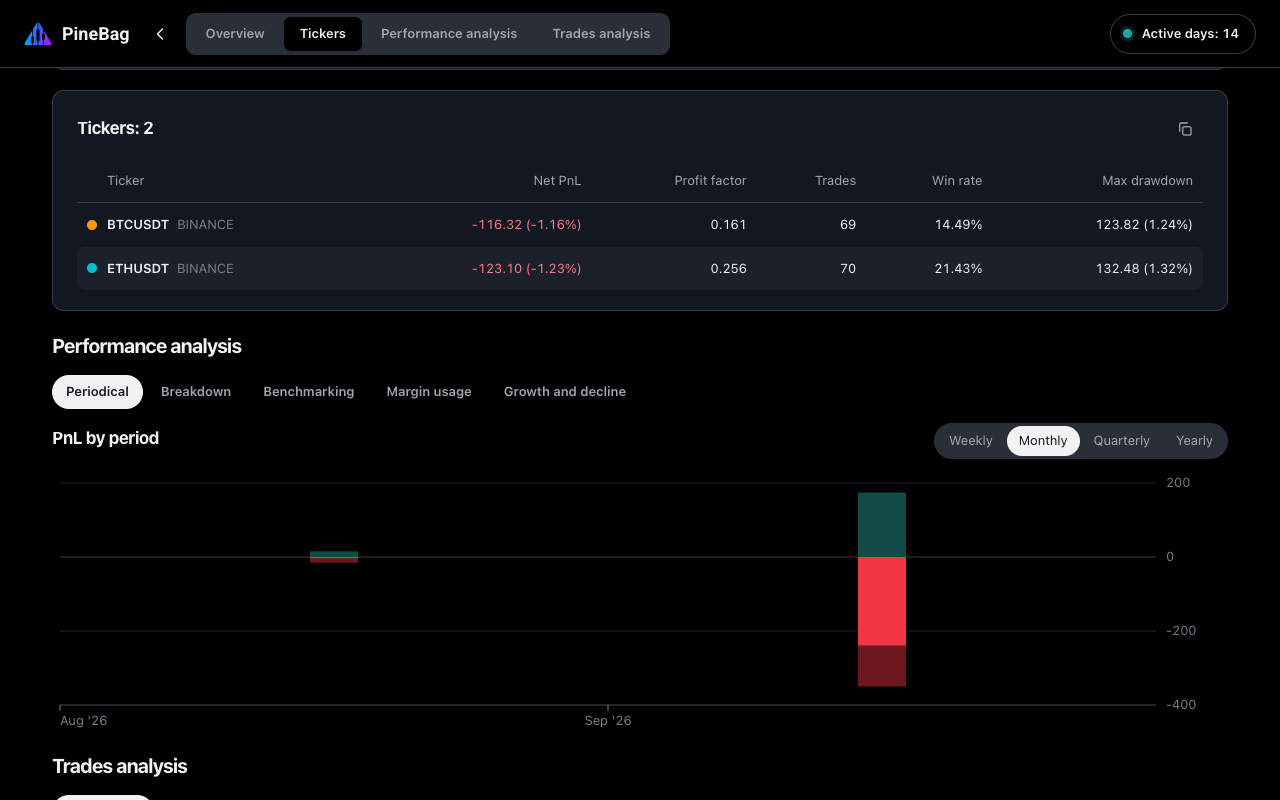
Sort contribution, profit, trades, win rate, profit factor and drawdown to find outliers.
Inspect annual and monthly consistency instead of relying on one full-range total.
Switch All, Long and Short to see which side of the strategy creates or removes value.
Narrow the report to a research interval without rerunning the original test.
Performance analysis
Performance views cover profitability, drawdown, expectancy, win/loss streaks and time-based patterns. Use them to test whether a result is broad and repeatable or dependent on a small cluster of trades.
- Profit factor compares gross profit with gross loss.
- Expectancy estimates the average outcome per trade.
- Drawdown shows the peak-to-trough decline in the tested series.
- Streaks expose clusters of wins and losses that totals can hide.
Trades
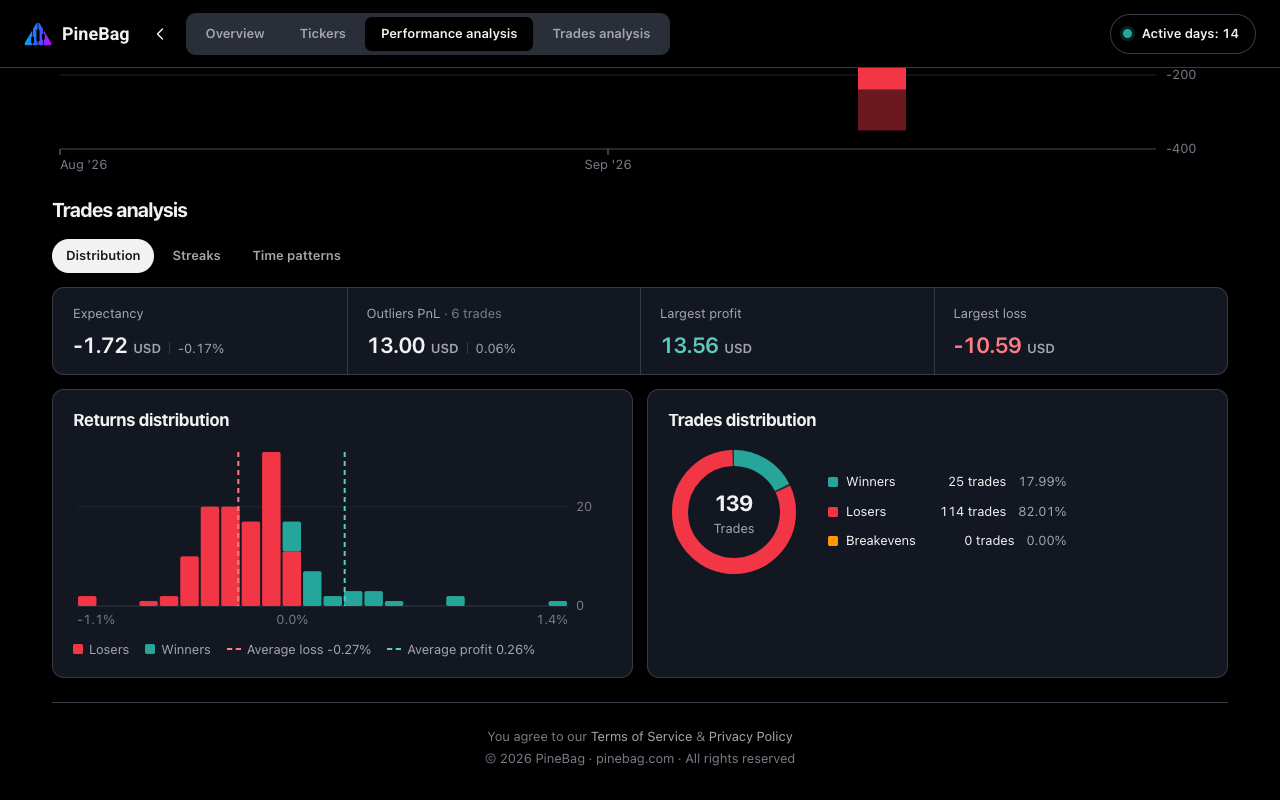
Filter trades by ticker, direction and period. Inspect entry and exit times, duration, P&L and sequences. Use the distribution charts to spot tails, timing effects and dependence on a few exceptional outcomes.
Save and export
PineBag keeps the latest 50 reports in the browser, including the strategy version used for the run. Export the full report as JSON for further analysis, or export the visible trade selection as CSV.